Politiscales is an online political positioning test. It is designed to be a more complete version on 8values, with 8 different axes.
Each axis has 2 separate variables for each side to account for uncertainty. For instance, you can have 62% for constructivism and 21% for essentialism, the remaining 17% being unattributed. The model therefore represents political opinions with 16 free variables.
My goal is to show that this high number of variables is redundant as most of the variance can be explained by a small number of variables.
Here’s an example from the dataset:
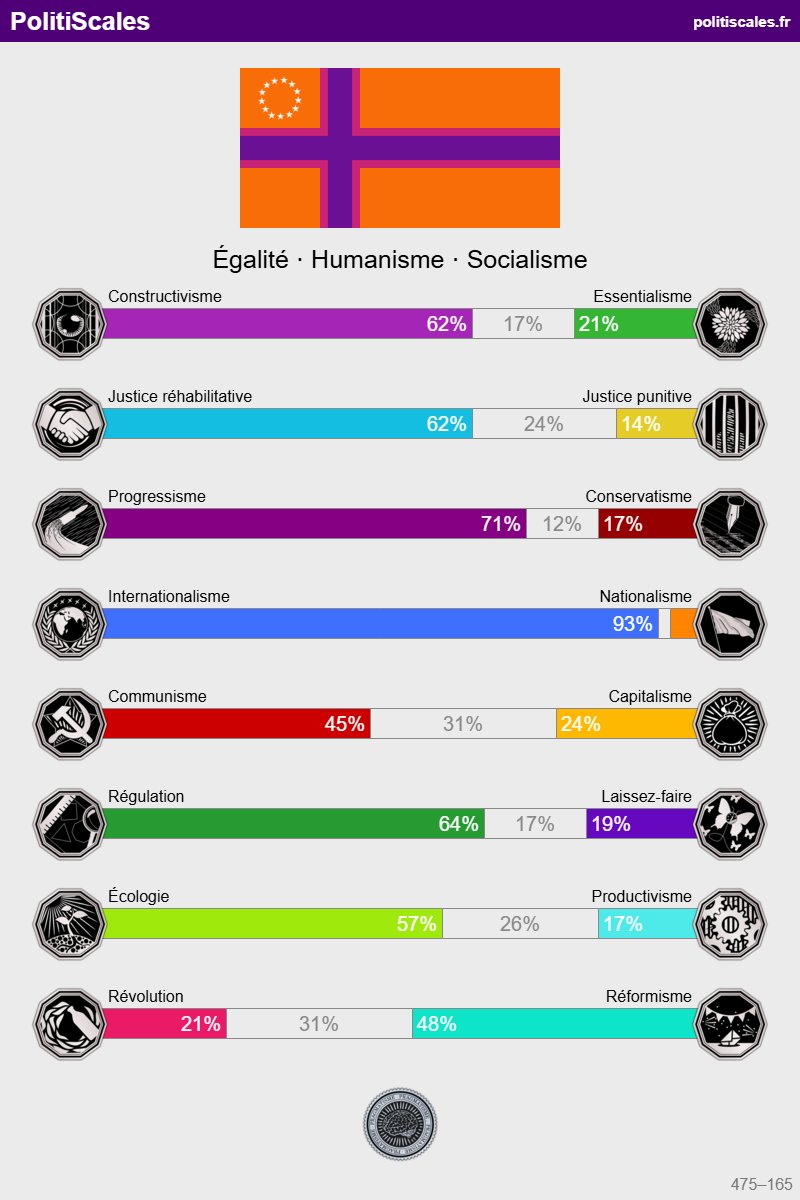
There are also binary categories such as conspiracy theorist, anarchist or feminist, but those were ignored in my analysis.
Data
I haven’t found a way to access answers to specific questions, so I resorted to using the test results themselves.
I downloaded over 300 screenshots of Politiscales results. They were taken from X and public Discord servers. I manually transcribed the values to a CSV file. I thought about automating it with some image recognition model, but the images have different formats, and some values aren’t shown directly and have to be deduced, so I figured it would be faster to do it manually.
A lot of the collected test results lean towards the left. It might overrepresent the variance patterns specific to the political left.
PCA
I then ran a PCA.
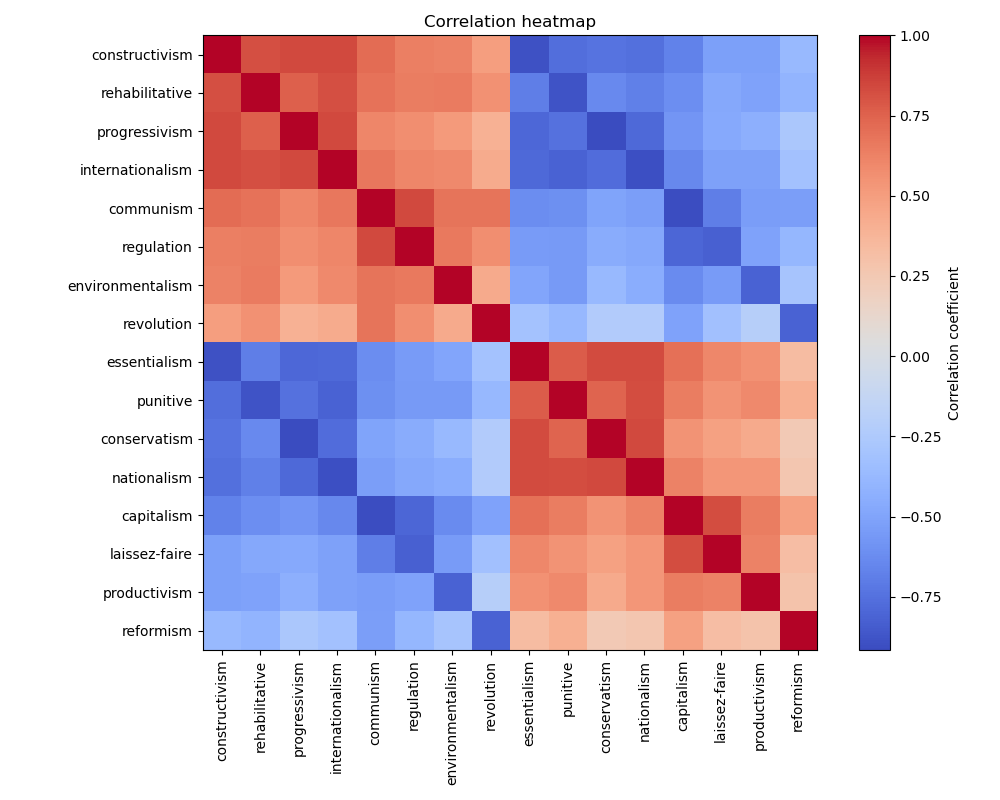
The correlation heatmap shows strong correlation of all political axes.
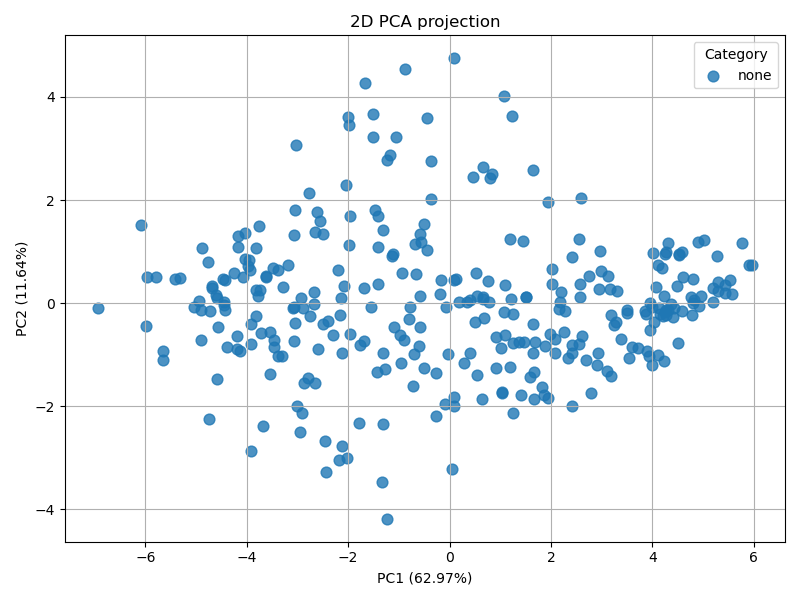
PC1 represents the left-right axis. PC2 (about 12% of the variance) is more interesting: it loads strongly with revolution, conservatism, nationalism, communism and regulation, and has strong negative loadings with their counterparts. It can be interpreted as a radical/liberal axis, with people wanting revolutionary action and state authority on one side, and people wanting gradual reform and less state intervention on the other.
| Item | PC1 | PC2 |
|---|---|---|
| constructivism | 0.282860 | -0.112103 |
| rehabilitative | 0.272208 | -0.035424 |
| progressivism | 0.267424 | -0.248543 |
| internationalism | 0.280005 | -0.189934 |
| communism | 0.267337 | 0.277353 |
| regulation | 0.250532 | 0.260720 |
| environmentalism | 0.230833 | 0.171446 |
| revolution | 0.179515 | 0.440279 |
| essentialism | -0.272176 | 0.218548 |
| punitive | -0.273292 | 0.155813 |
| conservatism | -0.248538 | 0.342387 |
| nationalism | -0.261409 | 0.308853 |
| capitalism | -0.268862 | -0.203413 |
| laissez-faire | -0.231577 | -0.168000 |
| productivism | -0.216428 | -0.065464 |
| reformism | -0.156844 | -0.402050 |
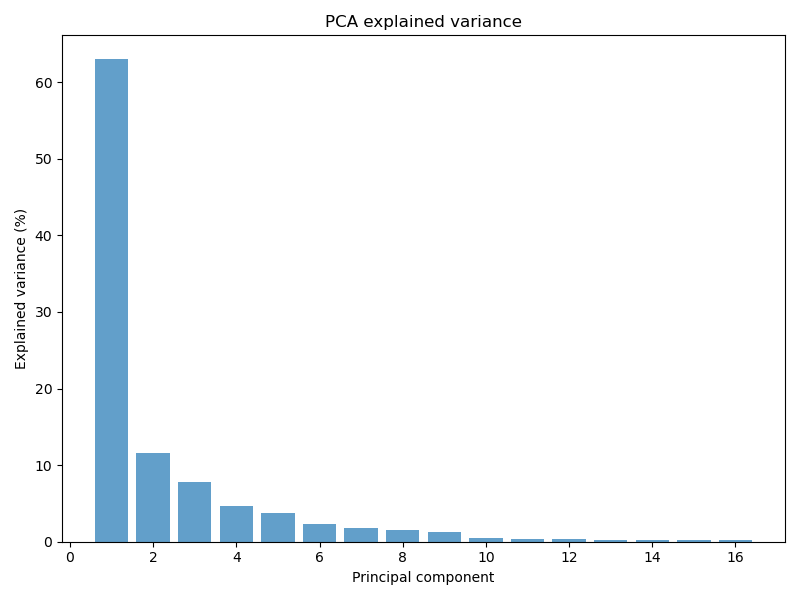
About 2/3 of the variance is explained by PC1, and 90% of the variance is explained by 5 components. This shows that the 16-variables model is highly redundant, as most variation in responses lies in a space of 2 to 5 dimensions.
Projecting all data points on a 2D plot along PC1 and PC2 yields this plot. Note that the left-right axis is inverted because PC1 correlates with left-leaning ideas, the leftmost points are more right-wing and vice versa.